• Recent
  • Towns
  • Topics
    • Arts
      • Language
      • Museums & Galleries
      • Public Art
    • Civic Life
      • Citizen Engagement
      • Governance
      • Health & Well-Being
      • Refugees
    • Community Heart & Soul
    • Economic Development
      • Breweries & Distilleries
      • Entrepreneurs
      • Transportation
    • Education
      • K-12
      • Community Colleges & Technical Training
      • Colleges & Universities
    • Environment & Sustainability
      • Parks & Recreation
      • Trees
    • Local Institutions
      • Libraries
    • Local Journalism
    • Travel
      • Aviation
  • Homepage
  • About
  • Donate
  • Newsletter
  • Recent
  • Towns
  • Topics
    • Arts
      • Language
      • Museums & Galleries
      • Public Art
    • Civic Life
      • Citizen Engagement
      • Governance
      • Health & Well-Being
      • Refugees
    • Community Heart & Soul
    • Economic Development
      • Breweries & Distilleries
      • Entrepreneurs
      • Transportation
    • Education
      • K-12
      • Community Colleges & Technical Training
      • Colleges & Universities
    • Environment & Sustainability
      • Parks & Recreation
      • Trees
    • Local Institutions
      • Libraries
    • Local Journalism
    • Travel
      • Aviation
  • Homepage
  • About
  • Donate
  • Newsletter
  • Local Institutions

Geo-Journalism Illustrates & Expands the Story

An interactive map of the Columbus, Ohio Library system illustrates the power of maps in reporting.

  • Shelli Stockton
  • May 8, 2021

Share

Republish

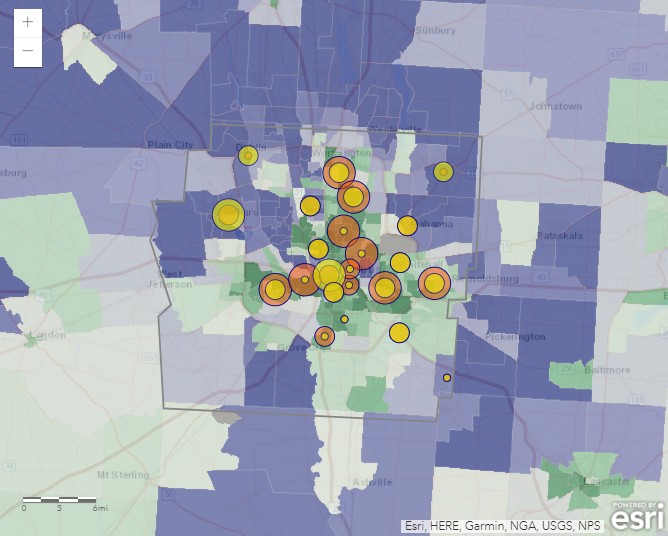
In her article, “How Libraries are Leading the Way to Digital Equity,” Deborah Fallows illustrates the use of computers and wifi across branches in the Columbus, Ohio library system using interactive maps. The maps, made with Our Towns Civic Foundation partner Esri’s ArcGIS software, allow the user to drill down into the map’s layers and study how computer use varies across demographic variables including income.

Here’s how to explore the map below:

  • In the map’s background colors, dark blue represents the areas’s highest income households. In descending order of income levels, grey background is next, then white, light green, and dark green.
  • Each circle represents a library branch. The size of the bright yellow of the circle shows the number of people who visit the library annually; the bigger the yellow circle, the greater the number of visitors.  The size of the pink circle shows the number of sessions recorded by the computers; the bigger the pink circle, the greater the number of sessions per computer.
  • If you click on the two arrows in the upper left of the map, the legend will pop up. If you click on a library, a set of pop-up bubbles offer geographic and demographic information for that branch. You can click through screens of information in the bubble including data for this map; the breakdown of income levels in the geographic tracts around the branch; and more.

Geo-journalism, in the form of interactive maps, is an area of journalism we hope to highlight in many upcoming articles. Its inherently visual nature helps bring stories to life in a new way.

Tweet
Share
Share
Share

Newsletter

For more from Our Towns, please sign up for our newsletter here.


Latest

  • Image of children playing around a water tower, with bright paintings on it and the message "You Have Found Lost Hills" 1
    Finding the City of Lost Hills
    • June 4, 2025
  • Library building on a sunny day in San Diego. 2
    How Libraries Are Becoming ‘Sustainable’
    • August 6, 2024
  • Children doing nature drawings, in antique photo. 3
    Sustainability: Suddenly the action is local.
    • May 9, 2024

Creative Commons License

Republish our articles for free, online or in print, under a Creative Commons license.

Close window X

Republish this article

Creative Commons License

This work is licensed under a Creative Commons Attribution-NoDerivatives 4.0 International License.

Thank you for your interest in republishing this story. This work is licensed under a Creative Commons Attribution-NoDerivatives 4.0 International License. Unless otherwise noted, Our Towns stories are free to republish our stories for free, online or in print. You may copy and print the article contents from the box below. Note: some images and interactive features may not be included here. Please review our complete Republishing Policy here.

Geo-Journalism Illustrates & Expands the Story

by Shelli Stockton, Our Towns
May 8, 2021

1

Related Articles

Library building on a sunny day in San Diego.
View Post
  • Libraries

How Libraries Are Becoming ‘Sustainable’

  • Deborah Fallows
  • August 6, 2024
View Post
  • Local Journalism

Florida Man!

  • Deborah Fallows
  • February 16, 2024
During Banned Books Week, the public libraries in Washington DC had readings of James Baldwin's banned works.
View Post
  • Libraries

Reading Banned Books Out Loud

  • Deborah Fallows
  • October 3, 2023

STAY CONNECTED

Receive the latest news and updates

SUBSCRIBE

© 2025 Our Towns Civic Foundation. All Rights Reserved.

  • Contact
  • Privacy Policy
  • Republishing Policy

Input your search keywords and press Enter.