• Recent
  • Towns
  • Topics
    • Arts
      • Language
      • Museums & Galleries
      • Public Art
    • Civic Life
      • Citizen Engagement
      • Governance
      • Health & Well-Being
      • Refugees
    • Community Heart & Soul
    • Economic Development
      • Breweries & Distilleries
      • Entrepreneurs
      • Transportation
    • Education
      • K-12
      • Community Colleges & Technical Training
      • Colleges & Universities
    • Environment & Sustainability
      • Parks & Recreation
      • Trees
    • Local Institutions
      • Libraries
    • Local Journalism
    • Travel
      • Aviation
  • Homepage
  • About
  • Donate
  • Newsletter
  • Recent
  • Towns
  • Topics
    • Arts
      • Language
      • Museums & Galleries
      • Public Art
    • Civic Life
      • Citizen Engagement
      • Governance
      • Health & Well-Being
      • Refugees
    • Community Heart & Soul
    • Economic Development
      • Breweries & Distilleries
      • Entrepreneurs
      • Transportation
    • Education
      • K-12
      • Community Colleges & Technical Training
      • Colleges & Universities
    • Environment & Sustainability
      • Parks & Recreation
      • Trees
    • Local Institutions
      • Libraries
    • Local Journalism
    • Travel
      • Aviation
  • Homepage
  • About
  • Donate
  • Newsletter
  • Economic Development

Mapping America’s Prospects, in Mississippi and Elsewhere

  • James Fallows
  • May 26, 2014

Images that illustrate the challenges and opportunities Americans face region-by-region

Richer (in blue), poorer (brownish), and poorest (lightest colored) areas of the deep South.
On Friday, I introduced the work of Joe Max Higgins, Brenda Lathan, Raj Shaunak, and others who over the past decade have attracted some $6 billion worth of industrial investment to the “Golden Triangle” area of Eastern Mississippi. That post included screen shots from maps that were designed to illustrate a simple baseline point: the economic challenge facing the state of Mississippi as a whole, including the Columbus-Starkville-West Point area that makes up the Golden Triangle. Depending on how you measure, Mississippi comes in at or near the bottom of most state rankings economically. For instance, in median household income, subject of the first map below, it stands at #50 among the states.

Now, with help from John Tierney, here are interactive versions of three maps that put the state’s challenge in perspective.

These maps, via the ArcGIS software from our partner Esri, are useful beyond their specific relevance for this state or the South. For one thing, they are zoomable. The more you click in, using the + button, the finer the resolution, until you end up seeing specific Census tracts and blocks. As you zoom back out, with the – button, you see averaged values for counties or states as a whole.

Also, these maps cover the entire country, so you can see how the values apply in other places of interest. Finally, they have pop-up labels and information. If you click on an area, a window will come up showing relevant info for the zone(s) that in view. As you’ll see, this behavior changes depending on how close-in or far-out you have zoomed, but it’s self explanatory.

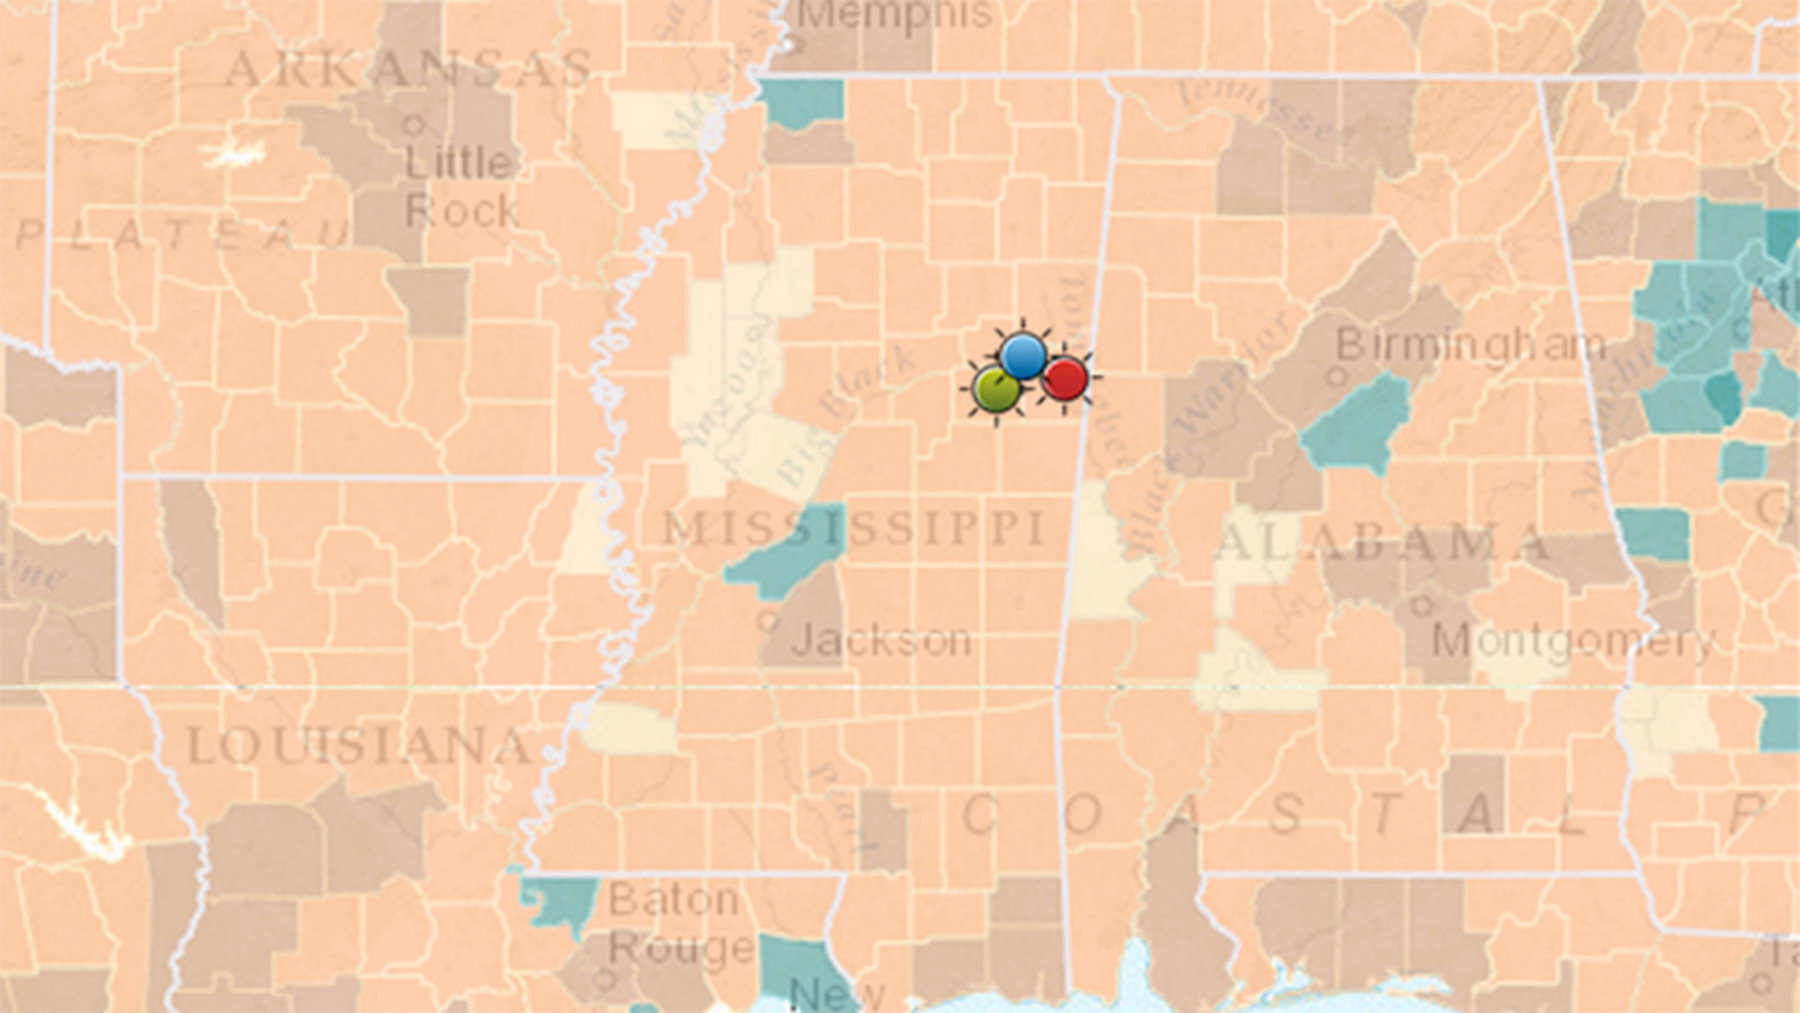
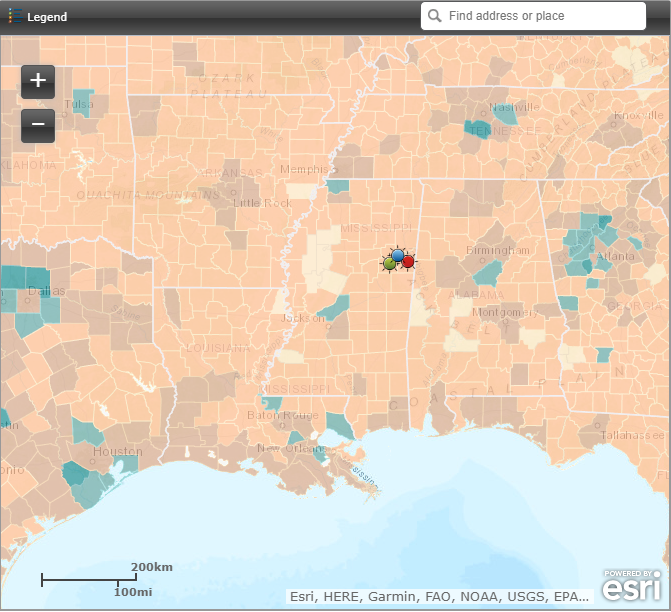
The first map is the one used for the previous post’s screen shots. It shows the median household income of any given area, compared with the national median of just over $50,000. The bluer and darker the color, the richer the households in that area. The lighter the coloring, the poorer. The further in you click, the finer-grained the classifications you will see — again, for anyplace, not just Mississippi. (The three dots on the maps are the three cities of the Golden Triangle: red for Columbus, blue for West Point, and green for Starkville.)

Esri Income Map

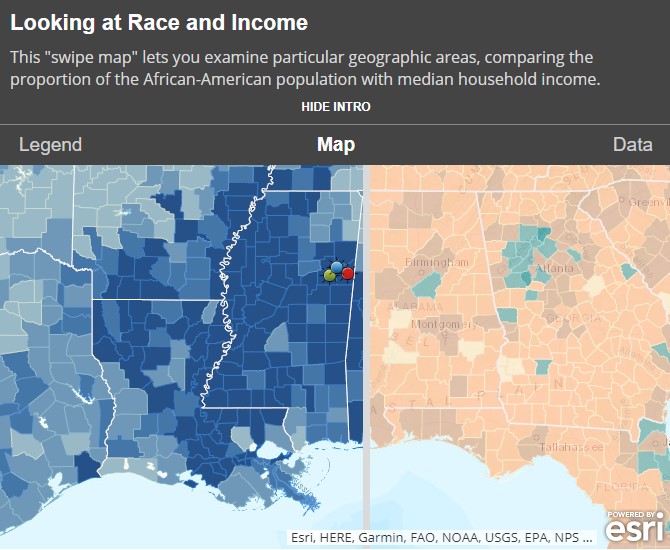
With this mapping technology, we can produce “swipable” maps, in which you can move a slider back and forth and compare different patterns or time periods. The correlations between income and race are striking—as, of course, Ta-Nehisi Coates has been demonstrating. Update: and now John Tierney has produced one of these illuminating swipe maps. It is below. Click on “Hide Intro” to see more of the map. Then move the slider back and forth to see how racial patterns correlate with economic ones. The two sides of the map will zoom and pan in sync. When you’re done with the South, try Washington DC, or Chicago. You’ll see some very clear patterns.

Esri Racial and Economic Patterns

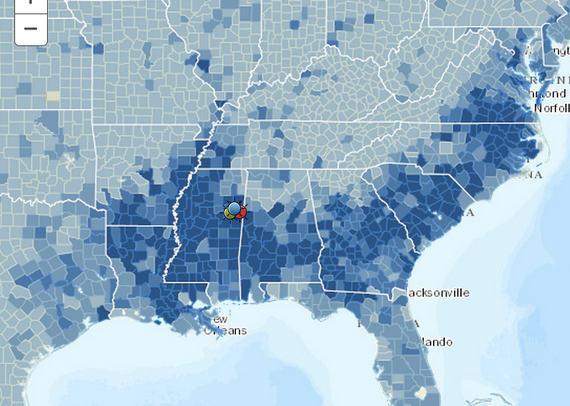
Also, Ta-Nehisi Coates’s article is about the 21st-century living influence of slave-holding patterns from the 17th century onward, plus the 19th and 20th century history of Jim Crow and segregation. This screen shot of America’s current racial distribution, zoomed out to regional scale, underscores his point. The areas with the greatest concentrations of African-Americans now are the areas where their forebears were brought and worked as slaves.

That is the mapping installment for today. Next: what has gone right in the Golden Triangle’s approach, and what (if anything) might be wrong with it.

And since today is Memorial Day, please see Deb Fallows’s post on the connections among this holiday, the city of Columbus, Mississippi, and our magazine.

Tweet
Share
Share
Share

Related Articles

A group of people stand on a catwalk looking down at a first-floor level lab.
View Post
  • Economic Development

Paths to New Prosperity and a Better Politics in Our Democracies

  • John C. Austin
  • May 18, 2023
Josh Landry installs fiber-optic cable in Dedham, Maine, as part of a broadband project that is putting in 60 miles of cable in the town of 1,600. (Photo by Carolyn Campbell)
View Post
  • Economic Development

Running Fiber-Optic Cable to Rural Communities Is Part of Maine’s Ambitious Broadband Plan

  • Carolyn Campbell, The Daily Yonder
  • January 26, 2023
A loose crowd of people walking around the inside of Detroit's Eastern Market.
View Post
  • Economic Development

What Midwest Industrial Communities can Teach about Managing Economic Change

  • John C. Austin
  • January 20, 2023

STAY CONNECTED

Receive the latest news and updates

SUBSCRIBE

© 2023 Our Towns Civic Foundation. All Rights Reserved.

  • Contact
  • Privacy Policy

Input your search keywords and press Enter.