Geographic information systems (GIS) harness the power of computers and data to make maps even more useful. For their “American Futures” Project at The Atlantic, Jim Fallows and his wife Deborah have partnered with ESRI, the premier GIS company, to bring the power of maps to bear in understanding how America is changing and, specifically, why some towns and small cities are proving to be more hardy and resilient than others.
As Jim noted when launching American Futures in early August, their intention is to use this technology in two ways. One is for explanation. “For instance,” Jim wrote, “if you want to understand the different politics and economics of North and South Dakota, a map of the Bakken shale-oil formation does a lot to explain.” And just today, Jim used a population “pressure” map to throw light on where America’s population is growing and why. (You can see other ways Jim and Deb have used maps so far in the American Futures series by going to this site, and scrolling through their articles by using the bar on the left side.)
Mainly we’re selecting cities the old fashioned way — via reading, reporting, one-idea-leading-to-another, plus pure accident and surprise. But we’re augmenting that process with “spatial statistics” tools. If you were looking for small cities with unusually stable employment levels, where would you find them? Or with good — or bad — records of absorbing immigrants? Or with unusually high rates of business-creation? Or with very strong school systems, or public-service cultures? And so on.
There is also a new-fangled process at work. (I’m offering this glimpse as a largely-behind-the-scenes member of the American Futures team — someone who only occasionally travels with Jim and Deb to do reporting. I’m trying to develop GIS mapping skills to make my Boston-based work for the series more useful.)
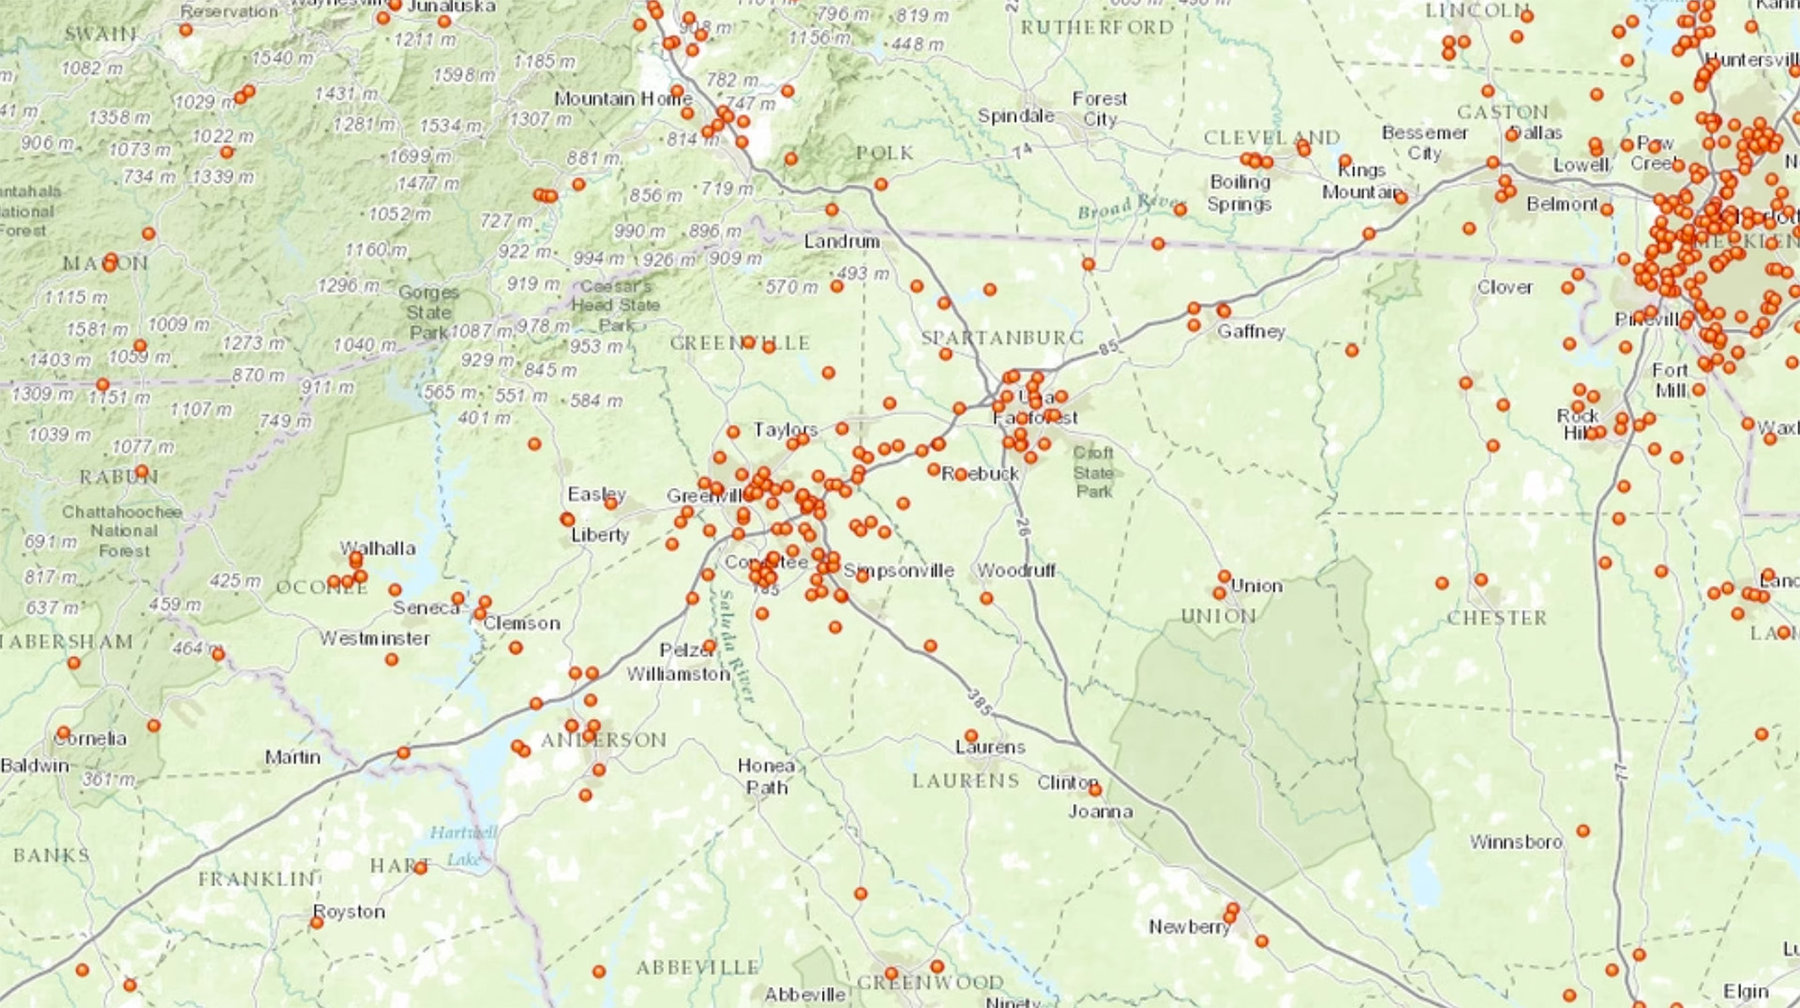
Esri’s ArcGIS software can show the distribution of high-tech manufacturing firms in the southeastern United States. Viewing the information this way allows Jim and Deb to see where these firms are clustered, helping to identify towns and cities that are lodestones of high-tech entrepreneurialism. Viewers can zoom in or out on the map and click on individual points to call up data such as the name of the company, its exact location, what line of work it’s in, and how many employees it has.
Geospatial information is transforming the way we see and understand the world around us. We plan to be using it much more in the months ahead for the American Futures series.